A battery e-ink dashboard that runs for months on one charge
A paper-like screen on the hall shelf with today's weather, a rain chart for the next twelve hours, your calendar, live departures and your to-do list. No cable: it wakes every 15 minutes, fetches a fresh picture, redraws and goes back to sleep, and a 2000mAh battery keeps it going for around three months. You render your own dashboard on your PC in step 1.
- The design pattern behind every good e-ink display: the server does the work, the battery board just shows a picture
- A kit: renderer, config, ESPHome YAML that validates and compiles with ESPHome 2026.9.1, battery calculator, systemd service, parts list
- A Seeed Studio XIAO 7.5in ePaper Panel (ESP32-C3, 800x480, 2000mAh battery; around £58 to £70) or an Inkplate
- An always-on computer on your network to run the renderer: a Raspberry Pi, NAS or home server
- uv for Python (uv docs ↗) and a USB-C data cable for the first flash
- Comfortable editing YAML and JSON. ESPHome basics help: Run AI on a £5 chip uses it too
Render your dashboard on your PC
See the exact picture your e-ink screen will show, built from live data, before you buy anything.
Why server-side renderingDrawing fonts, charts and calendars on a tiny battery board is slow, and every second awake costs battery. So a computer on your network draws the whole dashboard as an 800 by 480 black-and-white PNG, and the e-ink board just downloads it and shows it. Changing the layout never means reflashing the board.
The kitDownload the kit or open kit.md. Edit dash.json: your latitude and longitude, your calendar links, and your station. Then render once:
Terminaluv run --with pillow --with icalendar --with recurring-ical-events python dash_server.py --config dash.json --render dashboard.pngOutputwrote dashboard.png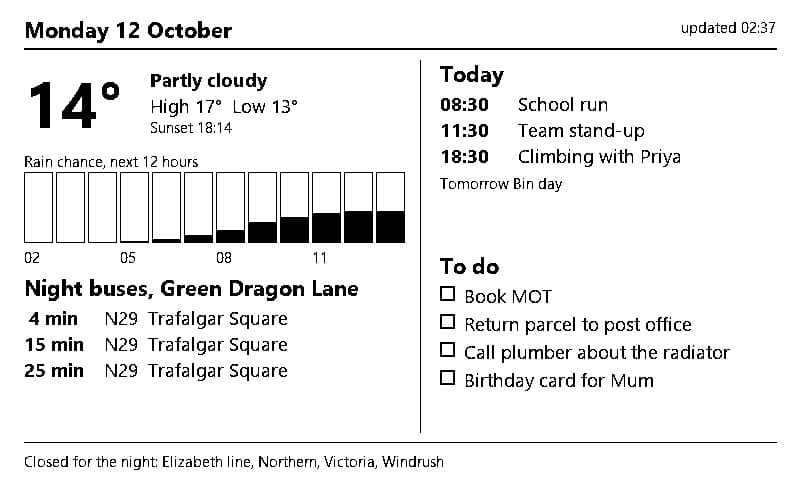
Rendered at 02:35 with live Open-Meteo weather, live TfL night buses and line status. Calendar events and to-dos are sample data. What's on itCurrent temperature and conditions, today's high, low and sunset, and a bar chart of the chance of rain for each of the next 12 hours (the most useful thing on the whole screen when you're deciding on a coat). Live departures from your stop, today's events with tomorrow's first one underneath, your to-dos with tick boxes, and the status of the lines you care about along the bottom.
If it breaksIt shows Calendar unavailable + 1 more
It shows Calendar unavailable
Fonts look blocky
sudo apt install fonts-dejavu-core.