Find the secret data feed behind any live website, and turn it into a spreadsheet
Most live websites quietly download their data as JSON in the background. Spot that request in your browser, replay it in the terminal, and turn it into a script that saves a spreadsheet and a map. Practice target: the USGS live earthquake map, which is public, free and needs no account.
- Every earthquake from the past week plotted on a world map, from the data you pulled yourself
- Google Chrome or Microsoft Edge (Firefox works too, its menus are worded slightly differently)
- uv, a one-line install that also gets you Python. Step 6 shows the command
- A terminal: Windows PowerShell (
curl.exeis built into Windows 10 and 11), or Terminal on a Mac or Linux (curl is already there)
Catch the page fetching its data
Everything the page shows came from somewhere. The Network tab shows you where.
Open the USGS Latest Earthquakes map ↗. It's run by the US Geological Survey, a government science agency, and shows every magnitude 2.5 or bigger earthquake in the last day. It updates itself while you watch, which is a big clue: the page must be downloading fresh data.
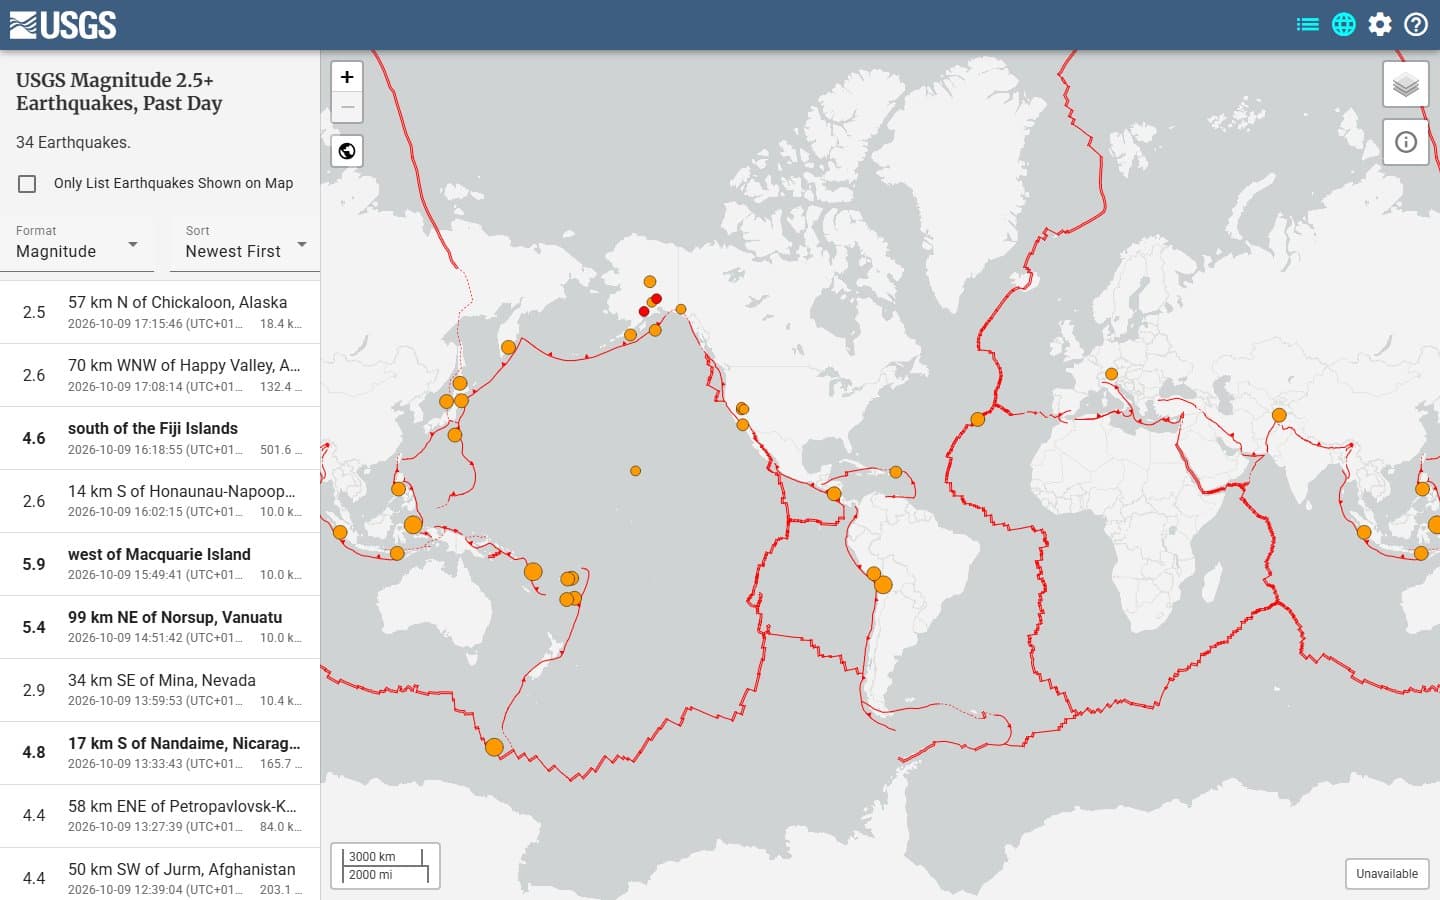
The page we're taking apart: 34 earthquakes in the past day at the moment of this screenshot. Now open your browser's developer tools (DevTools): press F12, or Ctrl + Shift + I (on a Mac, Cmd + Option + I). Click the Network tab. It lists every request the page makes, meaning every time it asks a server for something: pictures, fonts, code and data.
- 1. With the Network tab open, press Ctrl + R to reload. The list only records while DevTools is open, so it starts empty until you reload.
- 2. Click the Fetch/XHR button in the filter bar. That hides pictures, fonts and styles, and keeps only requests made by the page's own code. That's where data lives.
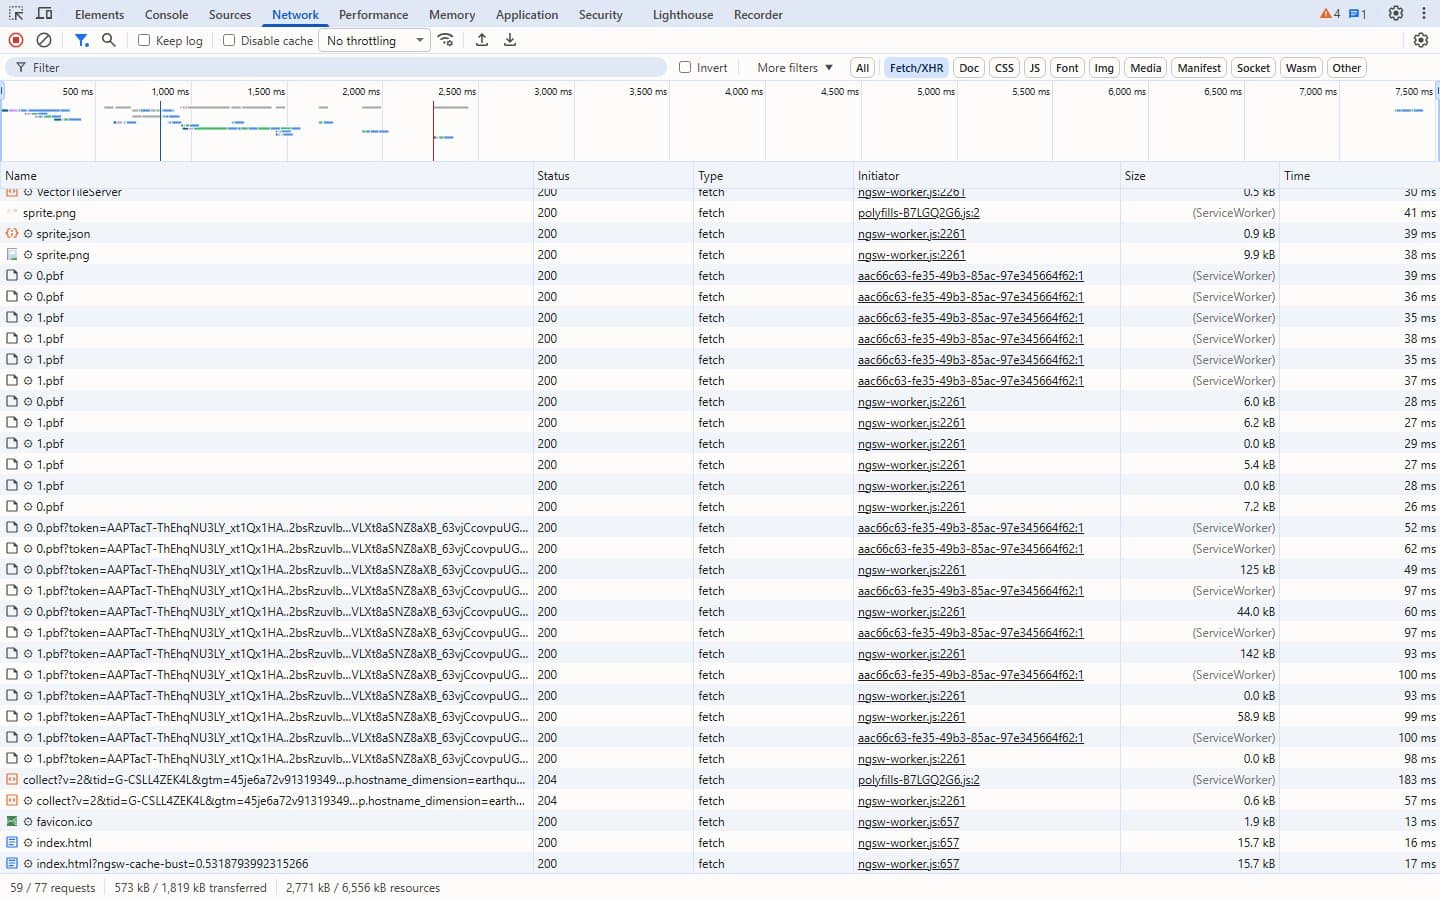
Still noisy: 59 of the page's 77 requests are Fetch/XHR. Most are map tiles (the .pbf files) and analytics. Too many to read one by one. Type geojson into the Filter box. JSON is the plain-text format websites use to pass data around (lists and labels in curly brackets), and GeoJSON is JSON for things with a location. Mapping sites love it.
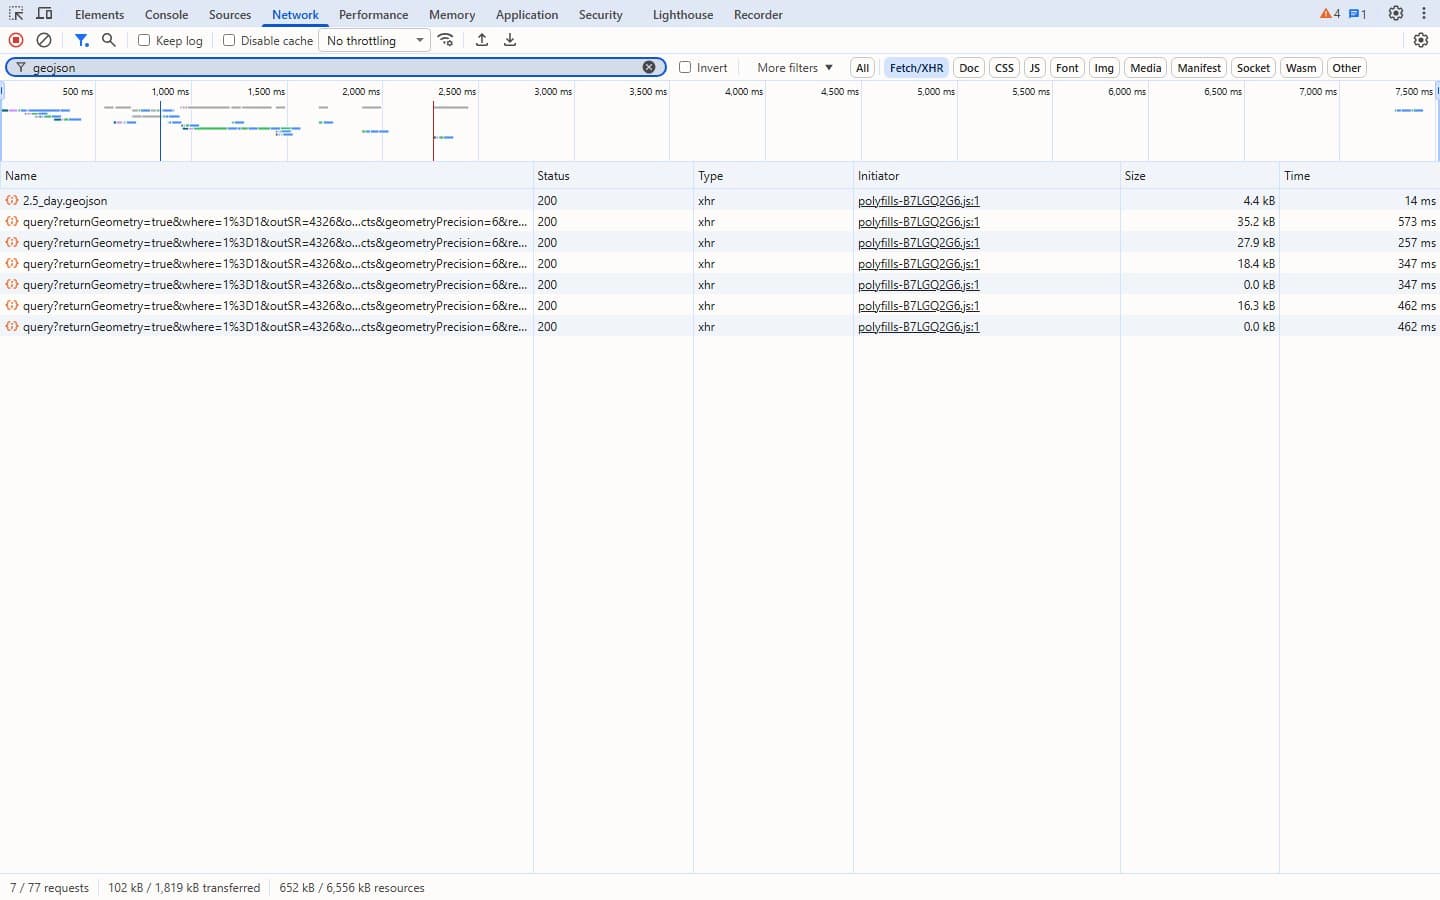
7 of 77 left. The top one, 2.5_day.geojson, matches the page title: Magnitude 2.5+, Past Day. The six
query?returnGeometry=...rows are the red lines on the map (the edges of the tectonic plates), from a different server. The one we want is 2.5_day.geojson.TipNo obvious name? Other tricks: sort by the Size column (data is often the biggest text request), or press Ctrl + F inside the Network tab and search for a word you can see on the page, like a place name. DevTools searches inside every response.TipTurn on Preserve log (the tickbox along the top of the Network tab) so the list survives reloads and redirects. You need it when the data loads during a login or a page change, which would otherwise clear the list before you can read it.TipThe Filter box takes more than plain words: typemime-type:application/jsonto show only JSON replies, and put a-in front to hide matches (-.pngdrops the images). It thins out a noisy page fast.